Page 1 of 1
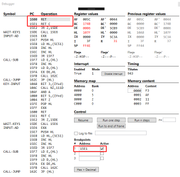
Show previous instruction for breakpoint in debugger
Posted: Sun Jul 29, 2018 8:18 pm
by Ralf
Maybe a basic question but I genuinely don't know the answer.
So I set a breakpoint in debugger and run the program. At some moment It hits the breakpoint and enters the debugger.
And it's a first instruction of some block of code. So I may suspect some JP or CALL was before it. But how can I find it without crazy guessing?
Does any emulators stores adresses of executed commands in some log so I could check the log and find a few instructions before my breakpoint?
Thanks for any help!
Re: Show previous instruction for breakpoint in debugger
Posted: Sun Jul 29, 2018 8:44 pm
by Ast A. Moore
Ralf wrote: ↑Sun Jul 29, 2018 8:18 pm
But how can I find it without crazy guessing?
Look at the stack. If there was a call, it’ll hold the address of the instruction
after the call.
Ralf wrote: ↑Sun Jul 29, 2018 8:18 pmDoes any emulators stores adresses of executed commands in some log so I could check the log and find a few instructions before my breakpoint?
Yes, SpecEmu does two things: (1) it shows the previous instruction right in the debugger, and (2) optionally allows you create runtime logs. Beware of the logs, though; they tend to get out of hand size-wise pretty fast.
Re: Show previous instruction for breakpoint in debugger
Posted: Sun Jul 29, 2018 10:52 pm
by Stefan
Ralf wrote: ↑Sun Jul 29, 2018 8:18 pm
So I set a breakpoint in debugger and run the program. At some moment It hits the breakpoint and enters the debugger.
And it's a first instruction of some block of code. So I may suspect some JP or CALL was before it. But how can I find it without crazy guessing?
Does any emulators stores adresses of executed commands in some log so I could check the log and find a few instructions before my breakpoint?
I've never used it, but the rewind function of
TommyGun sounds very promising.
Re: Show previous instruction for breakpoint in debugger
Posted: Mon Jul 30, 2018 9:59 am
by djnzx48
I just came across this disassembler called
z80dismblr which can generate some sort of control flow graph showing all the calls and jumps. It's probably overkill for this purpose but it might still be helpful.
Re: Show previous instruction for breakpoint in debugger
Posted: Mon Jul 30, 2018 10:39 am
by Ralf
Thanks!
It'll try different options, beginning with Spec Emu.
As for Tommy Gun, I have a general bad experience with it so it'll be my last resort.
Look at the stack. If there was a call, it’ll hold the address of the instruction after the call.
Yes, that would work in SOME cases.
But...
In general case we don't know if the instruction in breakpoint was reached by call or by jump. If it was reached by jump then stack will
show some last return point but it won't be my previous instruction.
And sometimes programs modify stack address or stack content. In such case the value at top of the stack will be totally meaningless.
Re: Show previous instruction for breakpoint in debugger
Posted: Mon Jul 30, 2018 12:22 pm
by Ast A. Moore
Ralf wrote: ↑Mon Jul 30, 2018 10:39 am
It'll try different options, beginning with Spec Emu.
I think it has the most powerful debugger out there. I use it on a regular basis, even though it doesn’t run natively on OS X. Fuse just doesn’t cut it sometimes.
Re: Show previous instruction for breakpoint in debugger
Posted: Mon Jul 30, 2018 1:52 pm
by AndyC
Ralf wrote: ↑Mon Jul 30, 2018 10:39 am
Yes, that would work in SOME cases.
But...
In general case we don't know if the instruction in breakpoint was reached by call or by jump. If it was reached by jump then stack will
show some last return point but it won't be my previous instruction.
And sometimes programs modify stack address or stack content. In such case the value at top of the stack will be totally meaningless.
Indeed. Any post-facto inspection can be fooled by abusive code. What would possibly be more useful is a breakpoint type that stops execution if the
next value of PC would execute the breakpoint line.
Re: Show previous instruction for breakpoint in debugger
Posted: Mon Jul 30, 2018 2:18 pm
by Ralf
What would possibly be more useful is a breakpoint type that stops execution if the next value of PC would execute the breakpoint line.
Yes, it would solve my problem.
Actually ZX Spin has quite advanced breakpoints. You may set them not on reaching some instruction but meeting some condition like "
A reqister equal to 1" or "
memory cell 30000 content equal to 100" and so on. I'll try to experiment what can be done with it.
But I suppose if I make a condition "
PC=30000" it will break into debugger at 30000, not at instruction just before 30000

Re: Show previous instruction for breakpoint in debugger
Posted: Mon Jul 30, 2018 3:01 pm
by Ast A. Moore
Ralf wrote: ↑Mon Jul 30, 2018 2:18 pm
Actually ZX Spin has quite advanced breakpoints. You may set them not on reaching some instruction but meeting some condition like "
A reqister equal to 1" or "
memory cell 30000 content equal to 100" and so on. I'll try to experiment what can be done with it.
Most debuggers can do that, including Fuse, by the way. There are even more sophisticated options available.
Ralf wrote: ↑Mon Jul 30, 2018 2:18 pmBut I suppose if I make a condition "
PC=30000" it will break into debugger at 30000, not at instruction just before 30000

Like I said, SpecEmu almost always displays the previous instruction address when you break into the debugger, even if you do it at a random point (without setting a breakpoint). If, however, you’re debugging your own code, you’re likely to know exactly how it’s supposed to branch out anyway.
Re: Show previous instruction for breakpoint in debugger
Posted: Mon Jul 30, 2018 8:46 pm
by AndyC
Ast A. Moore wrote: ↑Mon Jul 30, 2018 3:01 pm
If, however, you’re debugging your own code, you’re likely to know exactly how it’s supposed to branch out anyway.
Well, you probably know how it's
supposed to branch out, but if it were working you wouldn't need a debugger.

It's quite easy to POP a little too much off the stack, for example, and end up accidentally RETurning to the wrong piece of code in an unexpected state. A debugger which helps you spot that would probably be super handy.
Re: Show previous instruction for breakpoint in debugger
Posted: Mon Jul 30, 2018 10:22 pm
by Ast A. Moore
AndyC wrote: ↑Mon Jul 30, 2018 8:46 pm
Ast A. Moore wrote: ↑Mon Jul 30, 2018 3:01 pm
If, however, you’re debugging your own code, you’re likely to know exactly how it’s supposed to branch out anyway.
Well, you probably know how it's
supposed to branch out, but if it were working you wouldn't need a debugger.

It's quite easy to POP a little too much off the stack, for example, and end up accidentally RETurning to the wrong piece of code in an unexpected state. A debugger which helps you spot that would probably be super handy.
Oh, I’ve been burned by that exact situation on more occasions I’m willing to admit.

But my observation was more general in nature—debugging your own code is immensely easier than someone else’s.
P.S. Don’t underestimate the power of RZX recordings. They saved my butt so many times. Particularly indispensable for tracking down intermittent bugs.
Re: Show previous instruction for breakpoint in debugger
Posted: Tue Jul 31, 2018 3:19 am
by Seven.FFF
The way I debug this scenario in Zeus is to write a data breakpoint expression that breaks on the jump target address, which when breaking also prints the frame count (since emulation start) and tstate count (since the start of frame)*.
Knowing that jumps and calls are usually 10 or 17 Ts, I subtract one of these numbers from my printed numbers, and set another breakpoint to break when these values are hit. If they are, voilà.
If not, I try with 17, 12, 6, 4, whatever the other possible instructions are.
Zeus also has a feature similar to RZX recording, except it just records keystrokes and the Tstates they occurred. Unlike a RZX, playback is still possible after the code has been modified, because it’s only an event snapshot rather a code+event snapshot. I often use this recording and playback in conjunction with data breakpoints, particularly when the conditions to reproduce the target state are complicated.
Sounds fiddly, but really only takes a few minutes in practice.
Before I do stuff like this, of course, I also search memory for the two bytes of the jump target address! This will find any obvious JP <Address> instructions.
*In Zeus there is also a running Tstate count (since emulation start) which combines the two, and is even easier to reference.
Re: Show previous instruction for breakpoint in debugger
Posted: Tue Jul 31, 2018 8:53 am
by Magnus
Ralf wrote: ↑Sun Jul 29, 2018 8:18 pm
And it's a first instruction of some block of code. So I may suspect some JP or CALL was before it. But how can I find it without crazy guessing?
Does any emulators stores adresses of executed commands in some log so I could check the log and find a few instructions before my breakpoint?
Thanks for any help!
Hi Ralf,
My emulator actually "stops" on the instruction before the breakpoint (I use quotes here, because of course the emulator reaches the breakpoint). This is not really by design, but a side effect of how my debugger works. It is quite practical though.

